Introduction
RSI divergence is one of the simplest yet powerful tools in trading. When used effectively, this strategy can help traders identify potential reversals and profitable entry points. In this guide, we’ll dive deep into the concept of RSI divergence, how it works, and how you can apply it across different timeframes to enhance your trading game. We’ll use Binance as our primary trading platform due to its user-friendly interface, advanced tools, and attractive bonuses.
For those who are new to Binance, click here to join Binance and get a $100 bonus upon signing up! Binance provides an ideal environment to apply strategies like RSI divergence effectively.
What is RSI Divergence?
RSI (Relative Strength Index) is a momentum indicator that measures the speed and change of price movements. It typically ranges from 0 to 100 and is used to identify overbought or oversold conditions. RSI divergence occurs when the price action and RSI move in opposite directions, signaling potential trend reversals.
Types of RSI Divergence
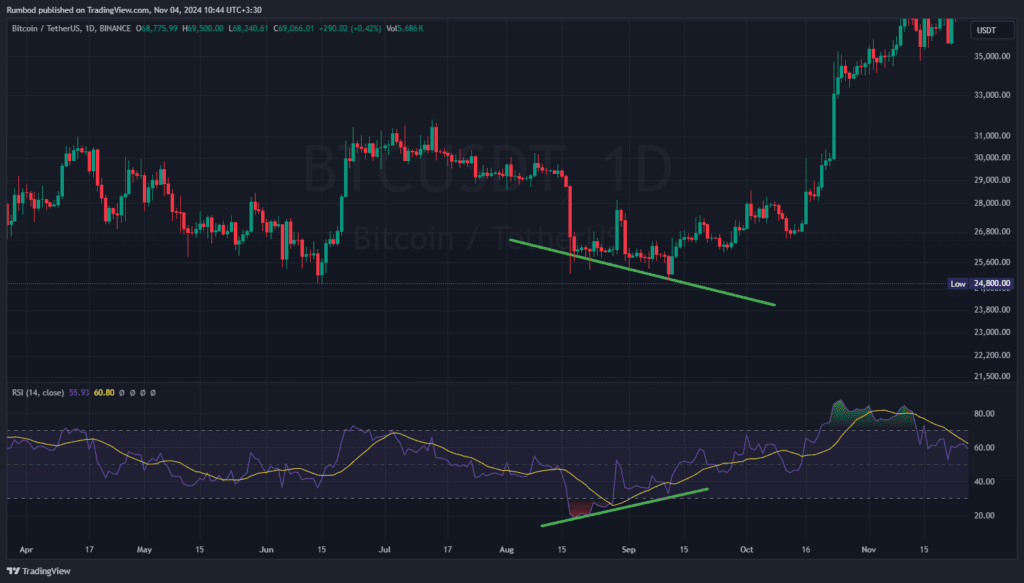
- Bullish Divergence: When the price makes a lower low, but the RSI forms a higher low. This indicates that although the price is dropping, the momentum is shifting upwards, hinting at a potential bullish reversal.
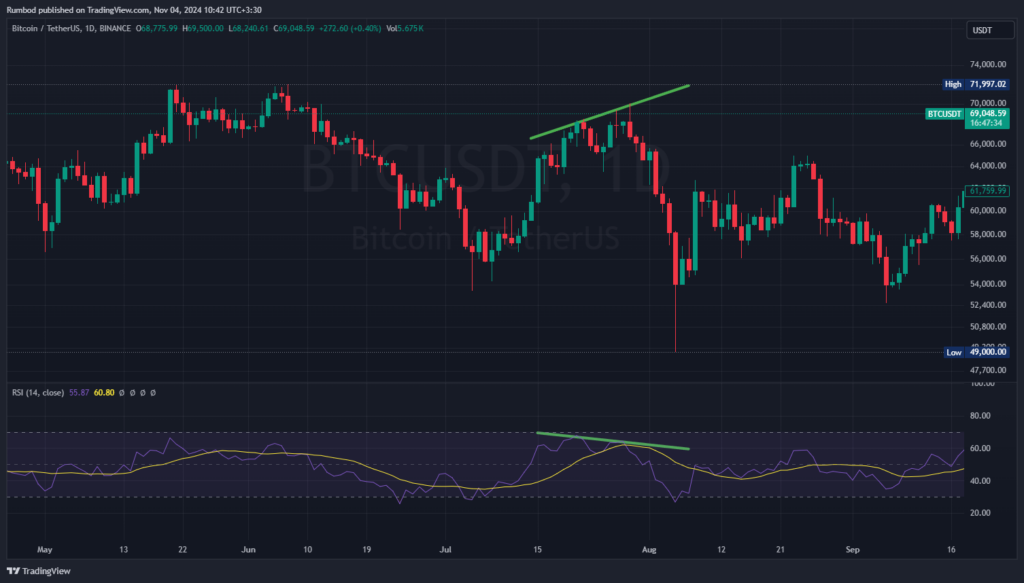
- Bearish Divergence: When the price makes a higher high, but the RSI forms a lower high. This suggests that the upward momentum is weakening, potentially leading to a bearish reversal.
Using RSI divergence in your trading can be particularly effective on platforms like Binance, where you have access to advanced charting tools and a wide range of assets. Sign up on Binance to start practicing this powerful strategy and capitalize on market movements.
How to Trade Using RSI Divergence
To make the most out of RSI divergence, follow these steps:
- Identify Divergence: Look for bullish or bearish divergence on your preferred timeframe. It can work on any timeframe (1-hour, 4-hour, daily), but higher timeframes usually provide more reliable signals.
- Confirm the Signal: Ensure that the divergence aligns with other indicators or technical analysis factors, like support and resistance levels.
- Entry and Exit Points: For bullish divergence, enter a long position near the support zone once the RSI confirms the divergence. For bearish divergence, enter a short position near the resistance zone.
- Set Stop-Loss and Take-Profit: Place a stop-loss slightly below the support level for bullish divergence and above the resistance for bearish divergence. Set a take-profit level based on your risk-reward ratio.
Let’s go through some real examples to better understand RSI divergence.
Example Analysis with RSI Divergence
Example 1: Bullish Divergence on BTC/USDT
In the chart below, BTC/USDT shows a bullish divergence:
- Price Action: Lower lows on the price chart.
- RSI: Higher lows on the RSI, indicating a potential reversal.
This divergence suggests a bullish reversal, making it a good entry point for a long position. Using Binance’s advanced trading tools, you can set up alerts to spot these divergences in real-time.

Example 2: Bearish Divergence on BTC/USDT
In this instance, BTC/USDT demonstrates a bearish divergence:
- Price Action: Higher highs on the price chart.
- RSI: Lower highs on the RSI, indicating a potential bearish reversal.
Here, you might consider a short position, betting on a downward trend. By trading on Binance, you can execute these strategies quickly and take advantage of the platform’s features.

Why Use Binance for Trading RSI Divergence?
Binance offers the ideal platform for implementing RSI divergence strategies due to its robust tools, real-time data, and extensive asset selection. Additionally, new users can get a $100 bonus upon joining by signing up here. This bonus can give you a head start in trading and testing your strategies without risking too much capital.
Tips for Mastering RSI Divergence
- Combine with Other Indicators: Use RSI divergence alongside other indicators like moving averages or MACD for stronger signals.
- Practice on Different Timeframes: Test this strategy on multiple timeframes to find what works best for your trading style.
- Stay Disciplined: Always use stop-loss orders and stick to your trading plan.
Conclusion
RSI divergence is a simple yet highly effective strategy that can provide excellent entry and exit points. By understanding and practicing this technique, you can significantly improve your trading results. Platforms like Binance make it easy to apply these strategies with advanced charting tools, real-time data, and a generous sign-up bonus.
So, if you’re ready to try out this RSI divergence strategy, join Binance today and get started with your $100 bonus. Whether you’re trading BTC, SOL, or other assets, this technique can be a valuable addition to your trading toolbox.
- Join Binance and Claim Your $100 Trading Bonus – Sign up on Binance to trade Bitcoin and use advanced tools for your RSI divergence strategy.
- Understanding the RSI Indicator – A comprehensive guide on the Relative Strength Index (RSI) and how it’s used in trading.
- Technical Analysis for Beginners – Learn the basics of technical analysis, including indicators like RSI, to improve your trading.
- Bitcoin Trading Strategies Explained – A guide to Bitcoin trading strategies that can help you understand how to apply RSI divergence effectively.
- RSI Divergence Trading Strategy – Explore how to spot and trade with RSI divergence on TradingView.
- History of Bitcoin: Unveiling Technology and Impact
